
If you’re feeling a little bit overwhelmed by Google’s upcoming Page Experience signal–don’t–because in this video, I’ll dive deep into the Core Web Vitals and why they’re so important.
(img)
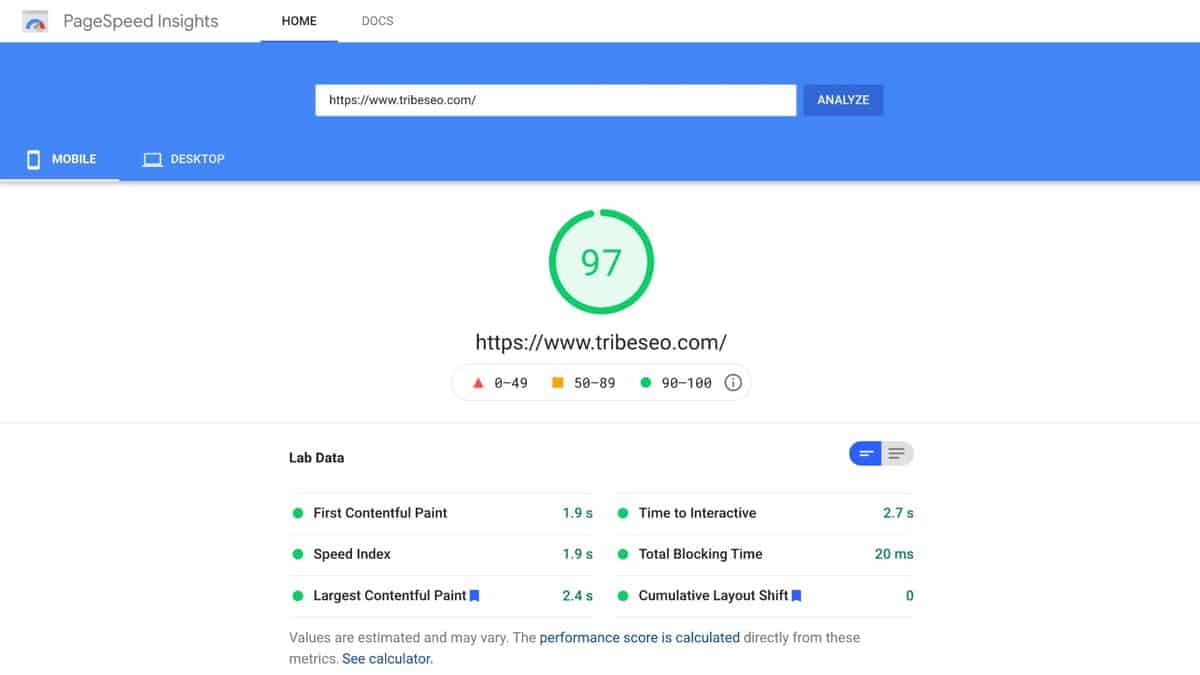
I’ll be stepping through how our website achieved 97% in the Google PageSpeed Insights mobile test, and this largely through Core Web Vitals optimisation.
In this video, you’ll learn what Core Web Vitals are, how to measure them, and you’ll discover opportunities in how to improve them for your website.
Hey, it’s Joe Williams from Tribe SEO, I’m here to help you get better SEO results and grow your business.
Okay, so this is the second in our five-part video series on Google’s Page Experience Update.
In the first video, we highlighted that Page Experience will soon be anew Google ranking signal that rolls out in May 2021.
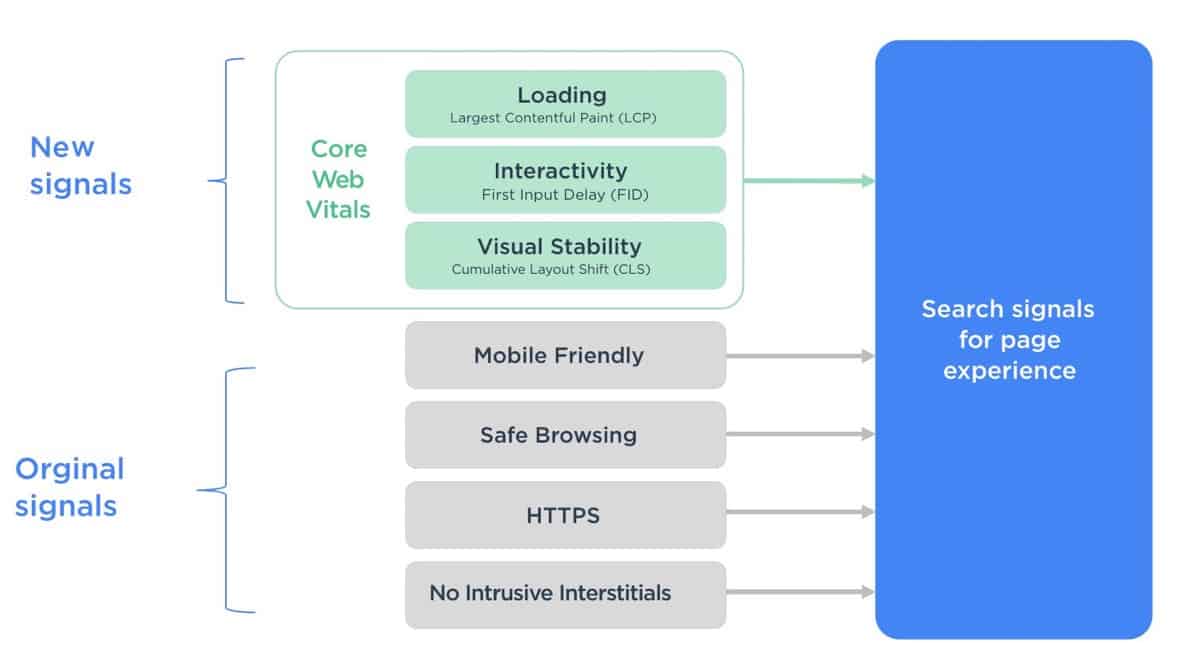
The video also highlighted what the original signals are and how to pass them.
This time around, I’m focusing on the new signals, which are collectively known as Core Web Vitals.
But, before I start, I just want to showcase my experience in this area.
Back at the end of 2020, and after completing my epic Learn SEO Fast course, I decided a celebration was in order.
I took the task of completely redesigning our website myself, and with one goal in mind: to make it faster and score higher for Core Web Vitals.
I stuck with WordPress, and you can see our homepage is pretty long.
It contains lots of images, nine videos and a live chat. All things that if you’re not too careful, can slow your website down to a snail pace.
But, I’m pleased to say that after some tinkering and late nights, the results were pretty amazing.
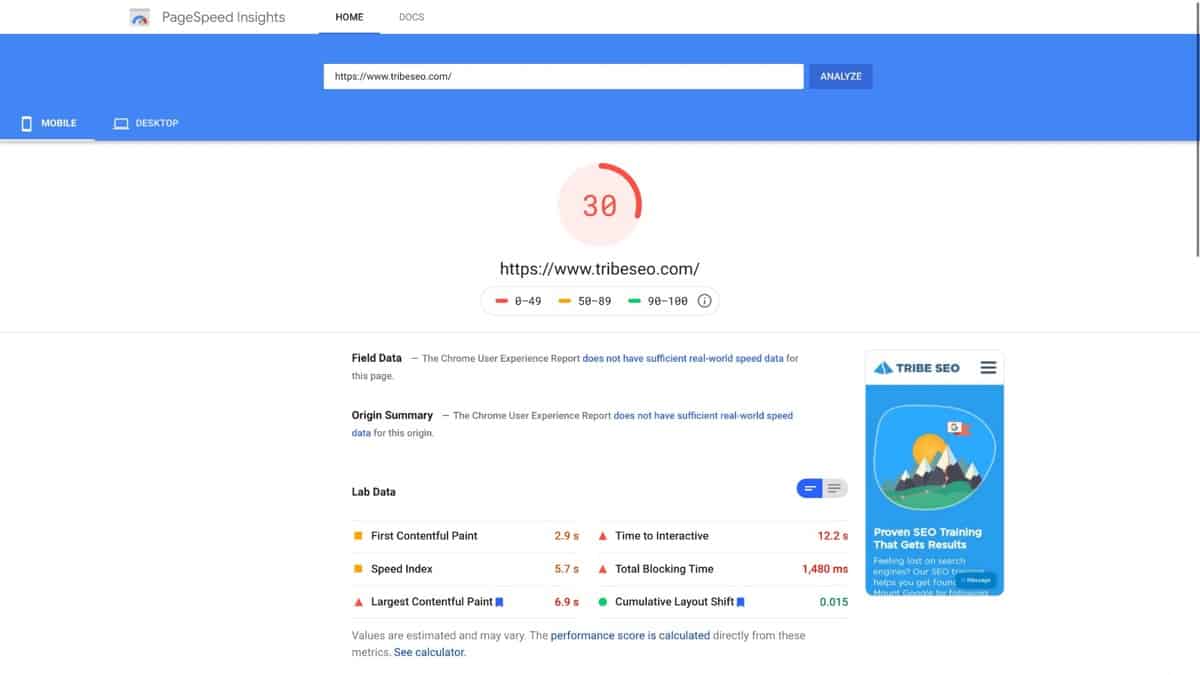
But first, let’s scoot over to the Google PageSpeed Insights tool and see how our old website faired before any Core Web Vitals optimisation took place.
Its performance score was a mere 30%.
Now, I don’t know if you’ve had a chance to run your website through the Google PageSpeed Insights tool lately… but I know many websites have experienced scores they weren’t happy with either.
Well, as of this recording, and when I run our new and improved homepage through Google PageSpeed Insights, I’m pleased to say the results are quite different.
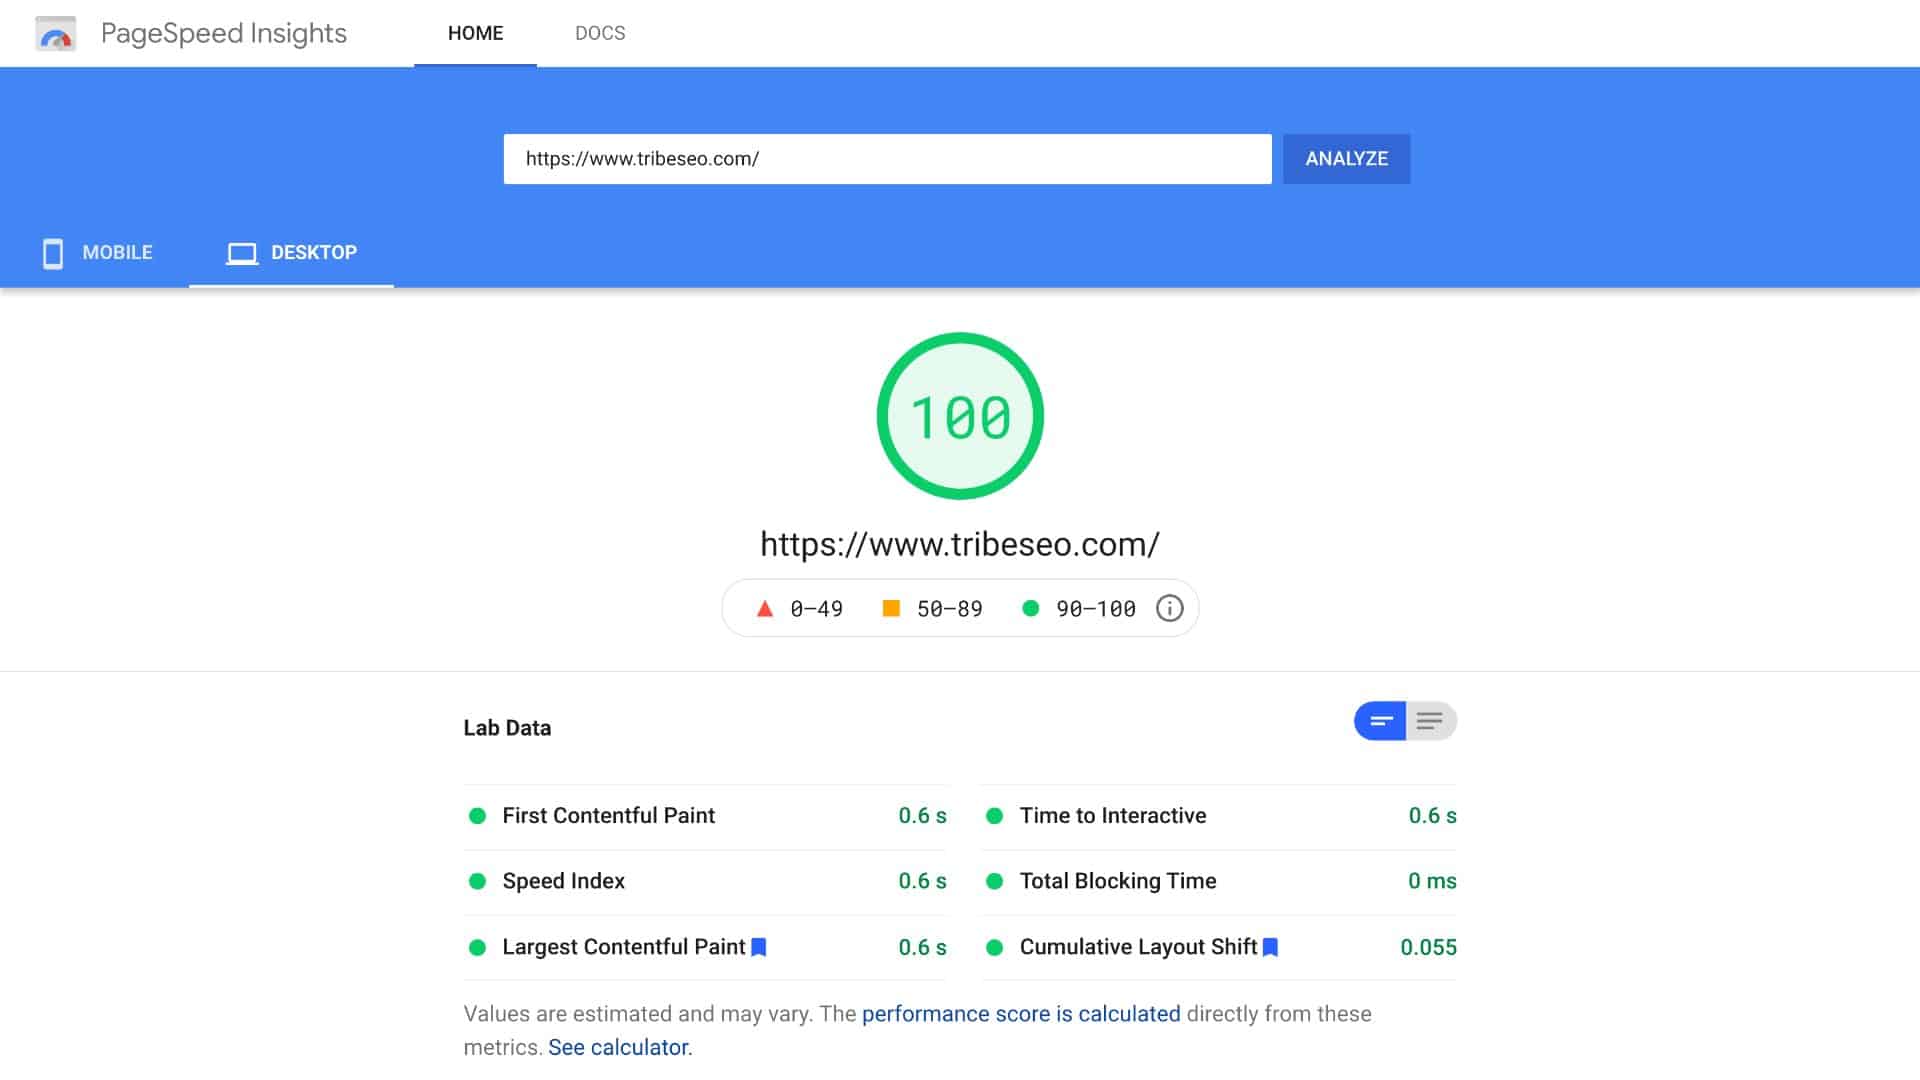
It’s now scoring 97%, when run from a mobile device… and 100% when run from a desktop.
Now, I want to stress, it’s the mobile score that you need to pay attention to because that’s what Google will be using in its Page Experience signal.
Since Google’s mobile-first indexing update, both indexing and ranking are based on the mobile version of your webpages, not the desktop.
But, why am I telling you about my high score?
Well, I’m not saying it to brag, I’m saying it because the key ingredients to a high Google PageSpeed Insights score are getting the Core Web Vitals right, and that’s what I’ll cover in this video.
Okay, so what are the Core Web Vitals?
The Core Web Vitals consist of three metrics that, when optimised, improve the user experience and the SEO ranking potential of a webpage.
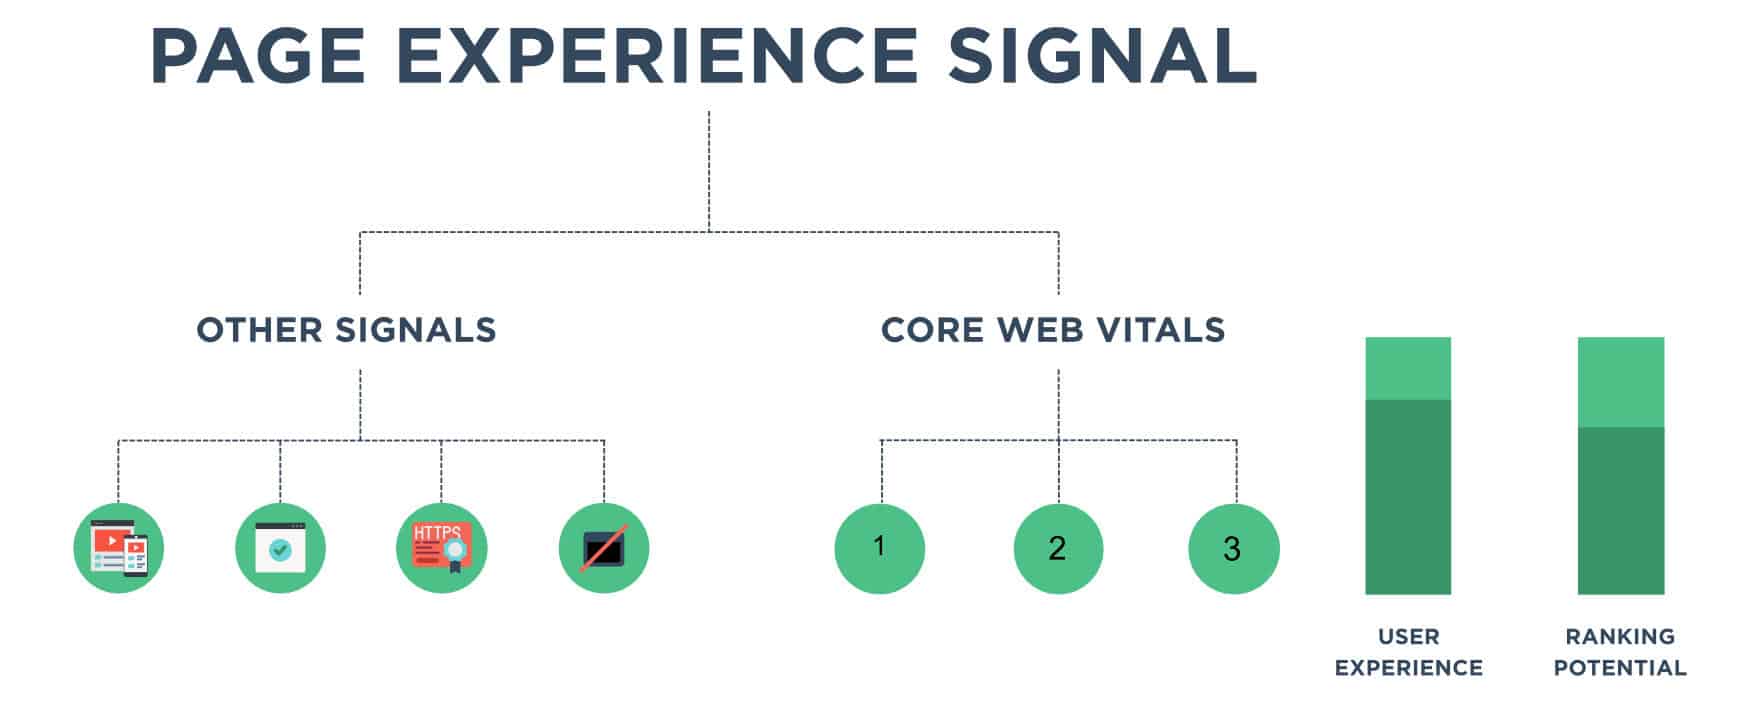
The Core Web Vitals are a subset of Google’s Page Experience signal and measure how visitors interact with a webpage and their perceived experiences.
So, what’s the first Core Web Vital?
Largest Contentful Paint (LCP) is the first Core Web Vital and according to the web.dev website, which Google has put together…
Largest Contentful Paint (LCP) is an important, user-centric metric for measuring perceived load speed because it marks the point in the page load timeline when the page’s main content has likely loaded—a fast LCP helps reassure the user that the page is useful.
Now, in the past, many page speed tools focused on measuring the “load” time. This is the time taken for all of the requests that make up a webpage to load.
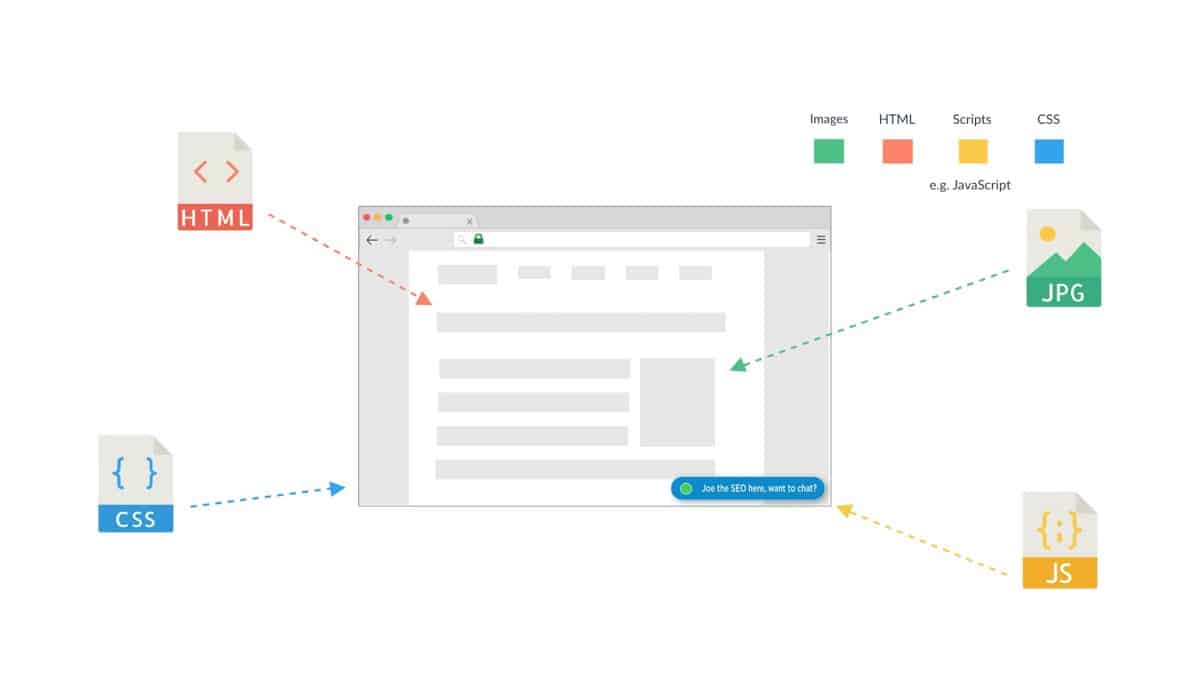
So requests include all the images you see on a page and the text, which is part of the HTML.
It also includes scripts that get fired in the background. For example, if your website has a live chat widget, it’s likely to be created in JavaScript.
And it also includes the CSS of the page, which provides its look and design.
When you add them all up and calculate the page load time, it’s not a true reflection of when the page actually becomes useful for your visitors.
Largest Contentful Paint (LCP) aims to tackle this by indicating when a webpage looks useful to your visitors.
So, how is LCP measured?
Well, according to Google…
The Largest Contentful Paint (LCP) metric reports the render time of the largest image or text block visible within the viewport.
Okay, so it’s the largest image or text element, but what is a viewport?
Well, the viewport is the visible area of a webpage on a device. If it’s on your smartphone, it’s the part of the page you see before scrolling.
So, let’s look at two examples.
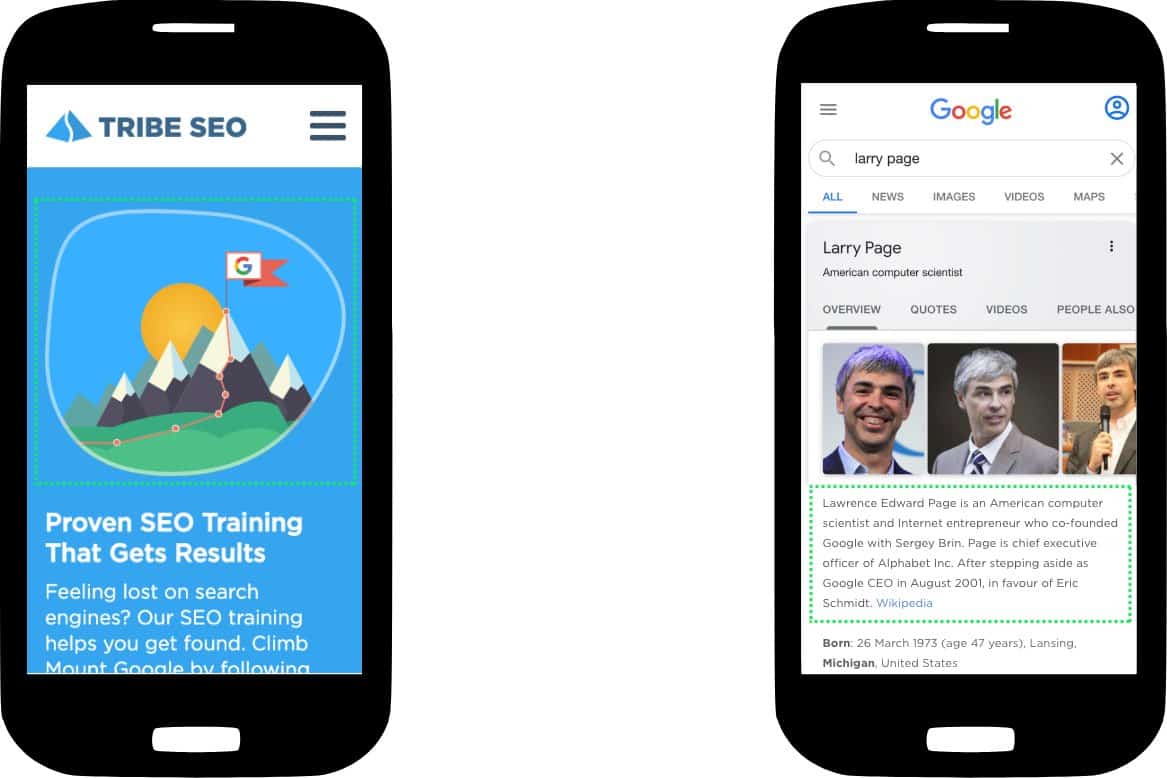
The first is from Tribe SEO’s homepage, and the second is for a Google query about one of its co-founders, Larry Page.
So, he’s a test.
Can you tell what’s the Largest Contentful Paint is for each webpage?
I’ll give you a moment.
Okay, If you thought the main image on the Tribe SEO website is the LCP, you’d be right!
However, if you said the main image on the Google page was the LCP, you’d be wrong. That’s because it’s actually three smaller images rather than one larger one.
So, in Google’s case, the text block takes up more room than any of the images, and it takes the title as the Largest Contentful Pain.
So, what’s considered a good LCP score?
Well, according to Google and from a mobile device, 2.5 seconds or less is considered a good score.

Between 2.5 and 4 seconds is moderate but needs improvement, and over four seconds is considered poor.
Now, you may be wondering how do you measure and optimise for the Largest Contentful Paint?
Bear with me, I’ll get to that in a moment.
But now, it’s time for the next Core Web Vital: First Input Delay (FID).
First Input Delay (FID) is an important, user-centric metric for measuring load responsiveness because it quantifies the experience users feel when trying to interact with unresponsive pages—a low FID helps ensure that the page is usable.
Okay, that was a bit of a mouthful, but what does it mean?
Well, FID measures the time it takes when a user interacts with an unresponsive webpage, such as when they click on a button or a link, to the time it takes the browser to respond to the interaction.
Now, if you’ve ever visited a webpage and quickly clicked on a button but it took an eternity to load, it’s likely due to a poor FID.
So, you can see having a fast First Input Delay or FID score goes a long way in offering a great user experience on your website.
So, what is a good FID score?
Well, according to Google and from a mobile device, 100 ms or less is considered good.
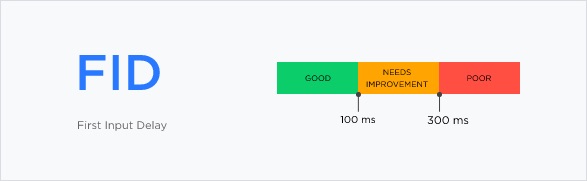
Between 100 and 300 ms is moderate but needs improvement, and over that is considered poor.
Okay, so let’s look at the final Core Web Vital: Cumulative Layout Shift (CLS).
Cumulative Layout Shift (CLS) is an important, user-centric metric for measuring visual stability because it helps quantify how often users experience unexpected layout shifts—a low CLS helps ensure that the page is delightful.
Okay, to showcase this, let’s look at one of Google’s playful examples.
Imagine you’re visiting London and want to buy a map of the underground. You’re on a website that sells maps, and you’re deep into the checkout process.
You’re ready to buy.
And of course, you only need one map.
But, you notice 56 of them added and when asked if this is correct. You quickly move to press “no”, but the layout of the page shifts, and as a result, you click “yes”.
Oh boy, how frustrating…
Now, this is an extreme example, and more often, the shifts are subtle.
For example, Google fonts are typically hosted on Google, so it’s common practice to load a more standard web font first, such as Times New Roman, which then gets replaced by a more attractive web font.

One downside to this approach is that because all web fonts are slightly different sizes, it results in the text shifting. This is particularly noticeable on a slower internet connection, which you often get from a mobile device.
More significant layout shifts can happen for several reasons. If a webpage contains advertisements, there is often a delay in loading them, resulting in large layout shifts.
So, you want all the elements of your webpages to remain in their starting position and not shift around as the page loads.
So, what’s a good CLS score?
Well, according to Google, 0.1 or less is considered good.
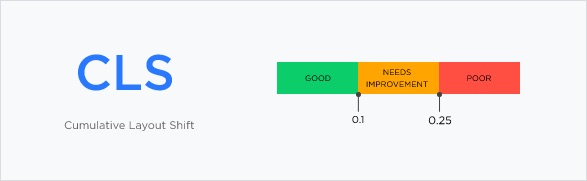
Between 0.1 and 0.25 is moderate but needs improvement, and over 0.25 is considered poor.
Okay, so now we’ve covered the three Core Web Vitals, how do you measure them?
Well, web.dev has a great resource. It lists an array of Google tools that allow you to measure the Core Web Vitals of your webpages.
If you have access to Google’s Search Console, that’s a good place to start, but it relies on Google collecting enough data about your website.
So, to keep things simple and make this accessible to all, let’s check out Google’s PageSpeed Insights report.
Now, I’m going to copy the URL from this Core Web Vitals Tools page, which is from a site created by Google, to see how it fairs in its own tool.
So, if Google is testing our websites, it’s only fair we try one of its own, right?
Okay, I’ll pop the URL into the PageSpeed Insights tool, and press “analyze”.
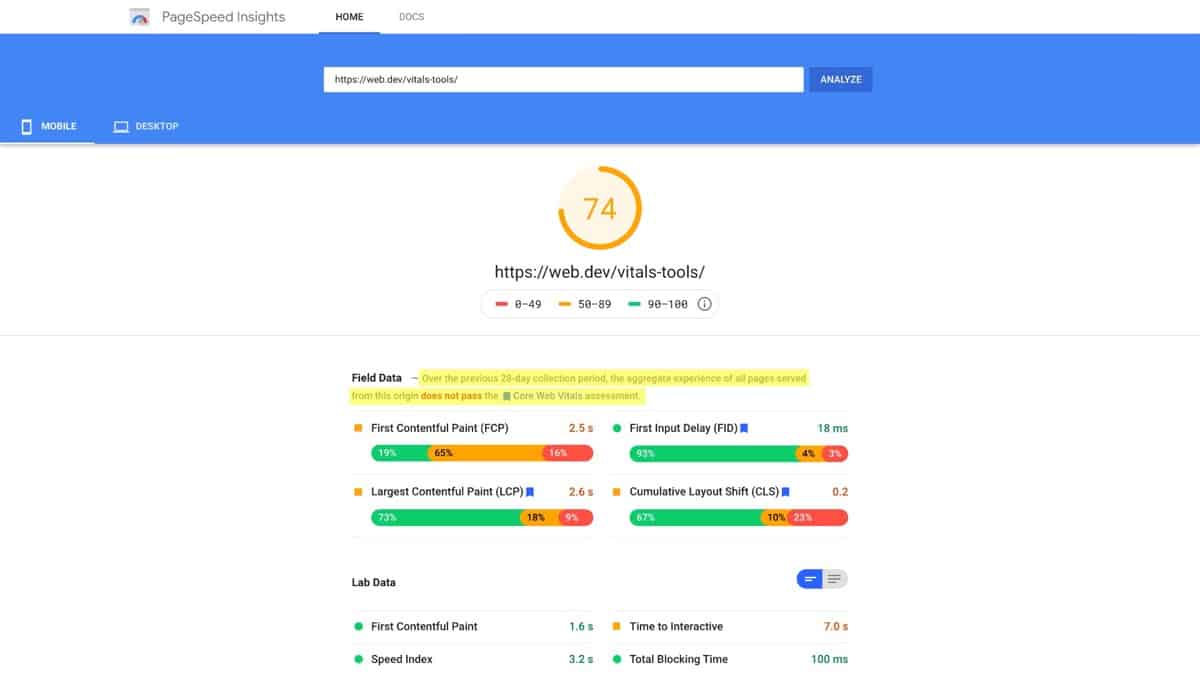
Right off the bat, you can see Google provides itself with a performance score of 74% and says:
Over the previous 28-day collection period, the aggregate experience of all pages served from this origin does not pass the Core Web Vitals assessment.
So–be warned–even Google struggles to pass this test. Although, this test was run a couple of weeks before publishing this video and Google has since improved its score.
Now, one important thing to note: the performance score is calculated using “lab data”.
So, while this is carried out in real-time, it’s not the real-life experiences your visitors face, but instead, a simulated environment in a computer lab controlled by Google.
If Google collects enough data about your website, you’ll also see “field data” collected from real-life experience, so actual visitors from Google Chrome, to your website.
Lab data is awesome for debugging issues and testing page speed tweaks you make to your website, while field data is better at seeing how your website has actually performed in the wild over 28 days.
So, let’s now review the three Core Web Vitals.
For Largest Contentful Paint and looking at the field data, we can see the page scores 2.6 s.
It’s 0.1 s over the good threshold, so it narrowly misses out on getting a green circle next to it and instead receives an orange square, which indicates the metric needs improvement.
However, when looking at the lab data, we can see the LCP is 4.9 s and gets a red triangle–which is within the poor benchmark range.
So, over the last 28 days, the LCP has been performing better than the test I did right now.
This could be a blip, or it may indicate that recent changes to the webpage or webserver have resulted in a lower LCP score.
Now, if we return to the field data and look at First Input Delay, we can see a score of 18 ms, which is in the good range, so you can see a green circle next to it.
However, if we head over to the lab data, you won’t find the FID metric there.
That’s because FID relies on aggregated user interactions which are hard to simulate in a lab environment. Instead, Google creates an equivalent metric called Total Blocking Time which you should use instead.
In this case, TBT gets a score of 100 ms and a green circle next to it, so that’s within the good range.
Now, back to the field data and this time, its Cummaltive Layout Shift. We can see it gets a 0.2 result and orange square, which indicates it needs improvement to make the good 0.1 or under, threshold.
For lab data, the CLS gets 0 and a green circle, which is good.
Now, the overall PageSpeed score is calculated from the six metrics, which you can see in the lab data.
But in this video, I’m focusing on the three Core Web Vitals, which is the second part of a five-part video series I’m running, Page Experience.
If you want to find out more about the other metrics, like First Contentful Paint, Speed Index and Time to Interactive, let me know in a comment below, and I’ll see if I can create a future video on them.
And… if you want to explore exactly how the performance score is calculated and weighted, Google provides a great resource.
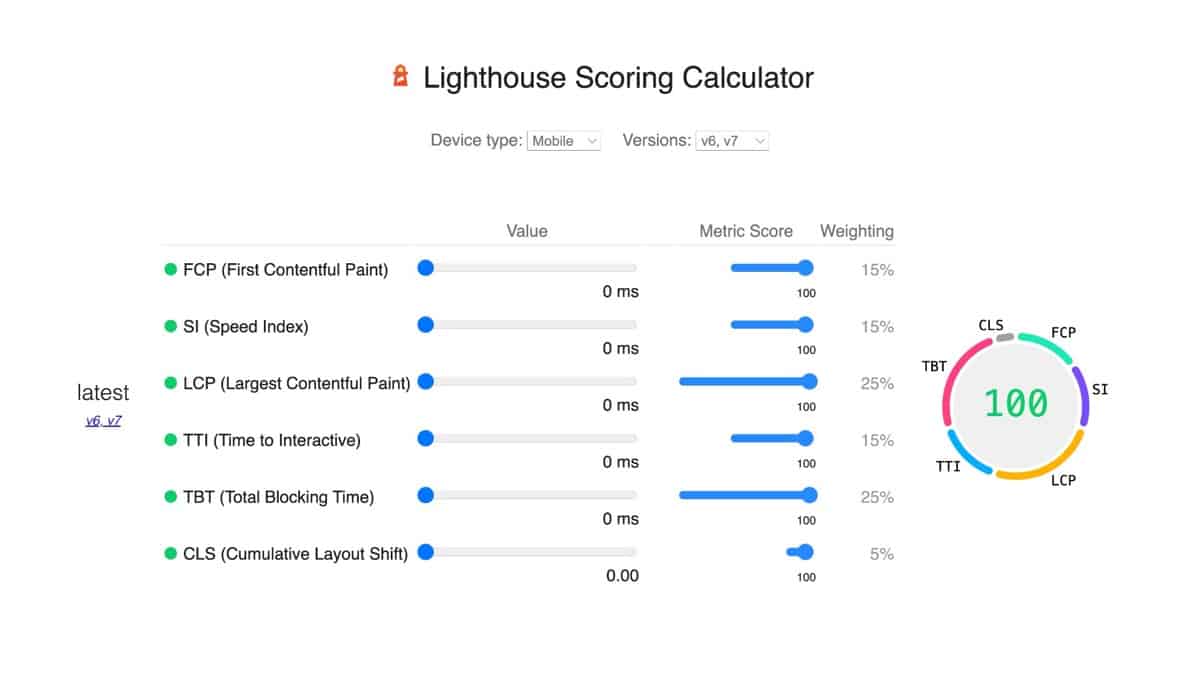
So, you can see Largest Contentful Paint gets 25% of the weighting.
Total Blocking Time also gets 25%, which is a lab metric that’s equivalent to First Input Delay, so that’s 50% for two of the Core Web Vitals.
What about the other Core Web Vital? Well, that’s Cumulative Layout Shift which only gets 5%.
I guess that’s because this is Google’s PageSpeed performance score, so a shift in the layout isn’t going to affect speed much–but it does affect usability. Google is highlighting it as an important user experience metric.
Okay, let’s scoot back to the performance score for the Web Vitals Tools page.
Now, because the Largest Contentful Paint has a red triangle next to it, it’s considered a poor score, and in fact, it’s the only lab metric considered poor.
And… we know LCP accounts for 25% of the performance weighting score, so improving this will make the most significant impact in getting a higher Google PageSpeed Insight score.
But how do you know what needs improving?
Well, if we scroll down, Google provides an “opportunities” and “diagnostics” section below.
Each section details areas of the page that can be improved, and they’re ordered by priority.
So, in the case of the “opportunities” section, fixing the suggestions with a red triangle has the potential to improve the performance of the page the most.
For example, Google is suggesting to defer offscreen images.
When I open the toggle, we can see more advice like the specific images that need attention and that lazy-loading the images is the fix required.
If you’re unsure about a suggestion, you can click the “learn more” link.
Okay, but there’s one more thing I want to cover before I go.
When interviewed, Google’s John Mueller hinted that all three Core Web Vitals must be met to qualify for a ranking boost.
So, all three vitals must get green circles next to them in your PageSpeed Insights scores.
That’s quite a task, but John also added that he wasn’t sure exactly how the final scores would be calculated and that there may be some room for “nearly” good scores.
So, now that you know what the Core Web Vitals are, why they’re important and how to measure them, I expect you’re wondering how you can improve them?
I’ll be covering this in our next three videos, starting with how to optimise Largest Conentuful Paint.
So, be sure to subscribe to our YouTube channel or head over to www.tribeseo.com/email, and you’ll be notified that way.
Okay, I’m Joe Williams from Tribe SEO, and I’ll see you in the next one.


Designed, Built and Optimised by Joe the SEO
© Tribe SEO is a registered UK Company (# 07455058). Privacy Policy and Terms.
This site is protected by reCAPTCHA and the Google Privacy Policy and Terms of Service apply.
